What does it mean to have a society
with more older people than younger ones?
By Cal J. Halvorsen, PhD, MSW
A publication from Encore.org, the Boston College School of Social Work,
and the Center on Aging & Work at Boston College
For the first time in history, there are more people over 60 than under 18 in the U.S. But what does that really mean? This report, in an FAQ format, has two aims: to place the aging of America in perspective and to discuss the impact of an aging society on our communities and economy.
Click here to see this report in a printable PDF format.
Suggested citation: Halvorsen, C. J. (2019). What does it mean to have a society with more older people than younger ones? Encore.org, Boston College School of Social Work, and Center on Aging & Work at Boston College
How many people turn 65 in the U.S. each day?
The Pew Research Center estimates that 10,000 people will turn 65 every day in the U.S. until the year 2030. That means that, on average, a person turns 65 in the U.S. every 8.64 seconds.
Here’s the calculation.

When will there be more older people than younger ones?
It depends on how you define “older.” For the first time ever, in 2019, there are more people in the U.S. over 60 than under 18. This demographic shift is part of a long-term trend:
- 1997 was the first year that there were more people in the U.S. over 50 than under 18.
- 2034 is projected to be the first year with more people in the U.S. over 65 than under 18.
Calculations by Cal J. Halvorsen, Boston College, using five combined data files from the U.S. Census Bureau that include a mix of national population estimates and projections: Years 1980 to 1989; 1990 to 2000; 2001 to 2009; 2010 to 2015; and 2016 to 2060.
How do the numbers and proportion of older and younger people compare over time?
Figure 1 (below) compares the populations of people under 18 to those over 60 over time. While the number of younger Americans is expected to slowly rise, the number of older people is increasing much more quickly. For example, since 1980, the number of people under 18 increased by about 10 million, while the number of people 60 and older increased by about 40 million.
Figure 1: Rising Numbers of Older Americans, in Millions

Calculations by Cal J. Halvorsen, Boston College, using five combined data files from the U.S. Census Bureau that include a mix of national population estimates and projections: Years 1980 to 1989; 1990 to 2000; 2001 to 2009; 2010 to 2015; and 2016 to 2060.
Figure 2 (below) shows the share of the population of three age groups over time. In 1985, for example, Americans 50 and older made up 26 percent of the total population. By 2055, people over 50 will make up 41 percent of the total population.
Figure 2: Share of Population by Age Group

Calculations by Cal J. Halvorsen, Boston College, using five combined data files from the U.S. Census Bureau that include a mix of national population estimates and projections: Years 1980 to 1989; 1990 to 2000; 2001 to 2009; 2010 to 2015; and 2016 to 2060.
How many younger people are there for each older person?
Sometime in the past year, there were just as many people under 18 as people over 60. Now, there are more older people. Figure 3 (below) shows the ratios for the number of people under 18 to the number of people over 60 over time. The orange line signifies a 1 to 1 ratio. Points above the orange line indicate more than one younger person for each older person, and points below indicate more than one older person for each younger person. While in 1980 there were about 1.79 people under 18 to every person over 60, by 2060, the relationship will be almost reversed, with 1.47 people over 60 for each person under 18 (equation: 1 older person / .68 younger persons = 1.47).
Figure 3. Ratio of Younger to Older Americans

Calculations by Cal J. Halvorsen, Boston College, using five combined data files from the U.S. Census Bureau that include a mix of national population estimates and projections: Years 1980 to 1989; 1990 to 2000; 2001 to 2009; 2010 to 2015; and 2016 to 2060.
Will the U.S. population begin to look like the populations of Florida and Maine?
It’s a common belief that Florida is the oldest state in the nation. Yet according to the U.S. Census Bureau, that title belongs to Maine. (Florida is actually the fifth oldest state, after Maine, New Hampshire, Vermont and West Virginia.) Utah is the youngest state.
Percentage of population over 50 or 60 in 2018¹

When will the U.S., overall, look like Florida and Maine do today? Another way to look at age distributions is by comparing the median age between states, which means that half of the population is older and half is younger than the median age. If you lined up every person in Maine in order by age, for example, the median age would be of the person standing directly in the middle — now about 44.9 years old. The U.S. Census Bureau projects the median age of the U.S. population decades into the future. As Figure 4 (below) shows, by the year 2050, the median age of the U.S. is projected to be similar to Florida’s median age today.
By the year 2060—the furthest the U.S. Census Bureau projects—the median age of the U.S. is still expected to be about 2 years younger than Maine is today.² This means that the population of Maine today is older than what the overall U.S. population will be in 2060. And the aging of Maine’s population is expected to continue, with its 65+ population projected to increase by 55 percent by 2026.
Figure 4. Median Age of the U.S. Population Over Time

Chart by Cal J. Halvorsen, Boston College, using U.S. Census Bureau data for state estimates and national projections.
¹ Calculations by Cal J. Halvorsen, Boston College, using data from the U.S. Census Bureau [Data set: Annual Estimates of the Civilian Population by Single Year of Age and Sex for the United States and States: April 1, 2010 to July 1, 2018]; ² The U.S. Census Bureau’s 2017 National Population Projections [Table 3]
What are the implications of an aging society on race and ethnicity?
The U.S. population is getting older and, at the same time, more racially and ethnically diverse. Today, most older people in the U.S. are white, while a growing share of younger adults are people of color. Some commentators refer to this as the grey-brown divide.
By 2045, the U.S. is projected to be a majority-minority country, where the non-Hispanic white population is projected to make up less than half of the total population.
Median age in 2018

Source: The U.S. Census Bureau’s Annual Estimates of the Resident Population by Sex, Single Year of Age, Race Alone or in Combination, and Hispanic Origin for the United States: April 1, 2010 to July 1, 2018 [Table PEPALL6N]; the white, Asian, black, American Indian and Alaska Native, and Native Hawaiian and Other Pacific Islander groups do not include those of Hispanic origin.
How are life expectancies changing?
Let’s look at life expectancy at birth (the average number of years a person would be expected to live when born today or in a given year) and life expectancy at age 65 (the average number of years a person who is 65 years old today or in a given year would be expected to live).
In 2016, life expectancy at birth was 78.6 years, nearly two years higher than it was in 2000 but slightly below the peak of 78.9 years in 2014. Experts have attributed this decline to several causes, including increases in deaths among those in their 20s and 30s from drug overdoses and suicides.
There are disparities in life expectancy by race and gender.
- The Hispanic population has the highest life expectancy at birth and at age 65, with the black, not Hispanic population having the lowest life expectancy at both time points.
- According to the National Center for Health Statistics, the gap in life expectancy between the non-Hispanic white and black populations decreased from 7.1 years in 1993 to 3.5 years in 2017, just shy of the smallest gap of 3.4 years in 2015.
- Across all racial and ethnic groups, women have higher life expectancies than men.
- Over the past 100 years, life expectancy at age 65 has increased by about eight years for women and six years for men.¹,²
There are also disparities in life expectancy by income.
- A study by researchers from MIT found that the richest 1 percent of the population live far longer than the poorest 1 percent.
- The richest men live 14.6 years longer than the poorest ones. And the richest women live 10.1 years longer than the poorest ones.
- While the richest 5 percent of the population added more than two years to their life expectancy over the past 15 years, the life expectancy of the poorest 5 percent of the population barely budged.
Life expectancy at birth and age 65³

¹ Social Security Administration (n.d.). Period life Table, 2016. ² Social Security Administration (n.d.). Life Tables for the United States Social Security Area 1900-2100. [Calendar Year 1920]. ³ National Center for Health Statistics, Centers for Disease Control and Prevention. (2018). [Table 15]; statistics for other races were not included in this report.
What about healthy life expectancy?
Lives are longer, but are these additional years vibrant and healthy ones? For the most part, yes, but these gains are not distributed equally.
A healthy life expectancy is defined as the number of years people are expected to live in good health. Here’s how it works: Assuming that the average 65-year-old American lives another 19.1 years to the age of 84.1, the average person could expect to live 13.9 of those years — or to the age of 78.9 — in good health.¹
How does this break down by gender and race? While women live longer than men, on average, the share of men’s and women’s years past age 65 in good health is about the same. But there is a clear disparity by race, with black Americans experiencing just 61 percent of their additional years in good health, compared to 74.5 percent for white Americans. Experts have tied disparities by race to differences in opportunity and risk throughout the lifecourse, often called cumulative advantage. Researchers have studied this in a variety of ways, including the role of cumulative advantage in midlife depression, cognitive impairment and self-rated health.
Life expectancy and healthy life expectancy by gender and race at age 65¹,²

¹ These statistics are based on 2007-2009 estimates, so they are slightly different from those used in the “How are life expectancies changing?” section above. ² Data from the CDC’s Morbidity and Mortality Weekly Report (2013, June 19), calculated to show expected total years of life from total years remaining; statistics for other races were not included in this report.
Just how healthy are the growing numbers of older people?
The National Center for Health Statistics, part of the Centers for Disease Control and Prevention, regularly issues reports on the health of the country. Its latest report shows that:
- Older people feel healthier. Just more than 21.6 percent Americans aged 65 and older reported fair or poor health in 2016, compared to 26.9 percent in 2000.
- Top killers are becoming less deadly. Death rates for heart disease, cancer, and stroke—some of the top causes of death among those 65 years and older—have continuously decreased since 2000. And death rates from all causes have also declined for older adults since at least 2006.
- Older people see prevention as key. Adults age 65 and older today are more likely to take key preventative measures — getting the influenza and pneumococcal vaccines, for example — than in the past.
- Overall, people function pretty well. Fewer than one in five (19.2%) adults age 65 and older report high levels of functional difficulty. The rest report either no difficulty (38.6%) or some difficulty (42.2%).
- Most live at home: An earlier report, using data from the 2010 Census, revealed that only 3.1 percent of people 65 and older lived in skilled nursing facilities.
Yet these gains are not equal. There continue to be health disparities by race and ethnicity when considering obesity and diabetes, or when assessing how healthy a person feels. Researchers are also finding that the older black and Hispanic populations are more likely to develop Alzheimer’s, dementia, or other forms of cognitive decline than the older white, non-Hispanic population.
What are the implications of our aging society on health care costs and the federal budget?
In 2018, Social Security and Medicare combined accounted for about 45 percent of all federal non-interest spending. This is expected to grow through the mid-2030s.
- Increasing numbers of older people will lead to increasing health care costs, both in total dollars and as a percentage of GDP.
- In 2017, nearly 50 million people age 65 and older were covered by Medicare, with this number set to rise, along with the program’s budget.
- Family members provide much of the care to those in need, with nearly half spending more than $5,000 in caregiving costs each year.
Experts have identified some opportunities to reduce the strain of our growing health care costs, including providing better care for those who have multiple chronic conditions.
What are the implications on caregiving?
Older adults are both providers and recipients of care. A 2015 survey by the AARP Public Policy Institute and the National Alliance for Caregiving estimated that about 43.5 million adults in the U.S. provided care to an adult or child in the past year; of those, about 34.2 million adults provided care to people over 50 years old.
The Pew Research Center found that adults ages 45 to 64 are the most likely to be caregivers for people over age 65, with nearly one quarter of people in this age group providing care. People age 65 and older are the second most likely age group to be caregivers for another older adult.
Older people provide care for children, too. In fact, about 2.7 million grandparents are raising their grandchildren, with about one-fifth of these older adults having income that falls below the poverty line.
Most caregivers (60%) are female. Among caregivers, about half felt that they had no choice but to provide care and, while not true for all, many stated that caregiving negatively affected their physical and mental health. Further, 61 percent stated that their worklife was impacted by providing caregiving, causing them to, for example, go in late or leave early, take a leave of absence, or reduce work hours.
What are the implications on the U.S. workforce?
The labor force participation rate for older workers continues to increase, with baby boomers working at the highest rate for people their age in more than 50 years. In fact, the U.S. Bureau of Labor Statistics estimated that while the share of younger workers will decline until at least 2024, the share of workers aged 55 and older will increase from about 13.1 percent in 2000 to 22.4 percent in 2016 and 24.8 percent by 2024.
Looked at another way, while the annual growth rate for most age groups in the labor force will be flat between now and 2024, the number of workers age 65 to 74 is projected to grow by 4.5 percent and the number of workers age 75 and older is projected to grow by 6.4 percent.
Greater numbers of older people in the labor force may be better for the economy. Working longer has been linked to an increase in the gross domestic product and a larger economic pie for older and younger workers overall. And older workers have been shown to be as productive as younger ones.
Is there interest among older workers in encore careers?
Encore.org spearheaded the discussion about encore careers, defined as work for the greater good in the second half of life. Its nationally representative studies in 2005, 2008, 2011, and 2014 have all shown a great deal of interest among older Americans to do work that makes a difference. Many already are, serving people across the life course in fields such as education, health care, social services and the environment. And four in five people (80%) in their encore careers report that their work gives them as much or even greater opportunity to contribute to society as their previous careers did.
What are the implications of a multigenerational workforce?
Research from Boston College suggests that age diversity in the workplace may stimulate and support creative thinking and innovation, and that age-diverse teams may perform better. A recent AARP survey supports these findings, revealing that most workers like working with people from other generations. Younger workers especially appreciate older workers for their skills as mentors, their perspectives, and their productivity.
Hiring older workers can also change perceptions of aging. A survey of nonprofit employers by Encore.org found that nonprofits with previous experience employing older workers were the most positive about hiring more. In a major sense, this research supports the “try it, you’ll like it” notion, giving hope that once older workers become more commonplace, ageist attitudes and beliefs toward them will decline.
These findings are echoed by the results from a recent report from the Second Acts for Strong Communities initiative. In a three-year pilot, nine organizations, all members of the Alliance for Strong Families and Communities, hired a diverse group of professionals over 50. They were dubbed Second Acts Fellows and tasked with mobilizing others over 50 in paid and volunteer roles. Over time, large numbers of nonprofit staff members changed their views about the value of encore talent in helping their organizations meet their mission, better serve their clients and community, and achieve sustainability.
Are older people starting businesses and launching nonprofits?
Entrepreneurship (a term often used interchangeably with self-employment) is a major type of employment for older people. The Ewing Marion Kauffman Foundation found that by 2017, more than one in four (26%) of all new business owners were age 55 to 64.
Among workers, the prevalence of self-employment rises with age.
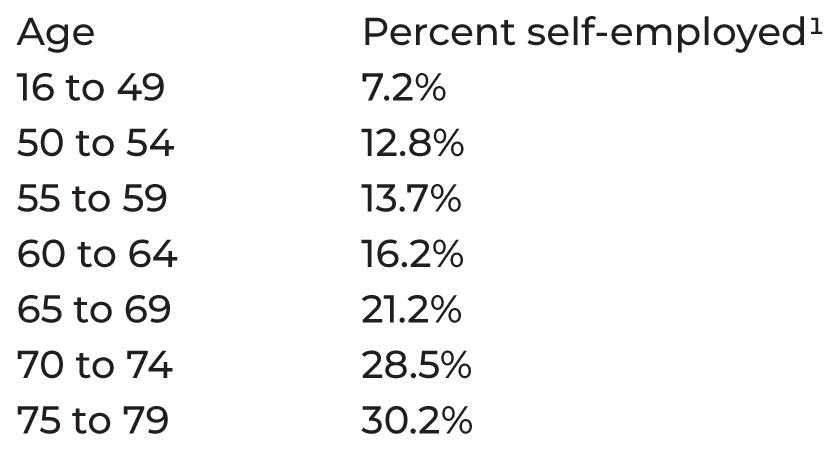
¹ From Pitt-Catsouphes, M., McNamara, T., James, J., & Halvorsen, C. (2017). Innovative pathways to meaningful work: Older adults as volunteers and self-employed entrepreneurs. In J. McCarthy & E. Parry (Eds.), Age diversity and work (pp. 195-224). London: Palgrave-Macmillan. doi:10.1057/978-1-137-46781-2_9
Plus, there are a lot more potential entrepreneurs. A recent study in the journal, PLoS ONE, estimates that more than 31 million diverse Americans aged 50 to 70—about 39 percent of this age group—are interested in starting new businesses or nonprofit organizations in the next five to 10 years.
Not only are older adults interested in entrepreneurship, they are also interested in starting new ventures for the social good. Results from the same PLoS ONE study revealed that among those interested in entrepreneurship, more than one in four (27%) reported that the primary purpose would be to meet a social challenge or to help others. This complements a previous study by Encore.org, which identified a potential group of older “encore entrepreneurs” seeking to launch income-generating ventures that make a positive difference in their communities.
How much do older people volunteer?
The Corporation for National and Community Service’s Volunteering in America report estimates that nearly 23 million baby boomers (those born between 1946 and 1964) volunteered for roughly 2.2 billion hours in 2017. Nearly one in three (30.7%) baby boomers volunteer, and their services were estimated to be worth $54.3 billion in 2017 alone.
Fewer baby boomers volunteer than members of Generation X, but more baby boomers volunteer than those from the Millennial generation. Among volunteers, baby boomers provide more hours of service than members of Generation X and Millennials.
Several organizations specialize in engaging older people in volunteer service, including AARP Experience Corps, Oasis, Senior Corps (Foster Grandparents, Senior Companions, RSVP), and others. Other organizations that seek volunteers of all ages have a high number of older volunteers. Big Brothers Big Sisters, a program that provides mentorship to young people, noted that nearly one in five (18%) of its volunteers is age 50 and older.
A good case study on the intergenerational benefits of older volunteers is AARP Experience Corps, which places older adult tutors and mentors in elementary schools to help students succeed in school and in life. A series of studies from Washington University in St. Louis and Johns Hopkins University noted the benefits that older volunteers have on children — including their reading comprehension and behavior — while also benefiting the mental and physical health and happiness of the older volunteers themselves.
What do we know about purposeful activity in later life?
A recent Stanford University study, conducted in partnership with Encore.org, found that the majority of older adults exhibit high levels of prosocial values and behaviors. In other words, they care for others and the environment, endorse equal treatment for all, and seek to understand those different from themselves. In total, this survey identified more than 34 million older adults who pursue activities that are both personally meaningful while contributing to the greater good — the researchers’ definition of purposeful activity.
This same survey showed that, “Purpose is an equal-opportunity pursuit.” As the report explains, “The prevalence of purposeful living does not vary significantly across income, health status or geography. The one meaningful difference is that the prevalence of purpose was higher among people of color than among whites. Overall, however, what stands out is that purpose is common to all.”
About the author
 Cal J. Halvorsen, PhD, MSW, is an assistant professor at the Boston College School of Social Work and an affiliate of the Center on Aging & Work at Boston College. His research interests include the antecedents, experiences, and outcomes of longer working lives, with emphasis on later-life self-employment and entrepreneurship, encore careers, and older adults as social innovators. Cal was selected as an inaugural member of the 2018-2019 Encore Public Voices Fellowship. Prior to earning his Ph.D., Cal worked for six years at Encore.org, a national nonprofit organization dedicated to engaging people in midlife and beyond in paid and unpaid work that improves the world, later serving as the organization’s director of research. He is a graduate of both the MSW and PhD programs at the Brown School at Washington University in St. Louis and earned his BA from the University of Iowa in his hometown of Iowa City.